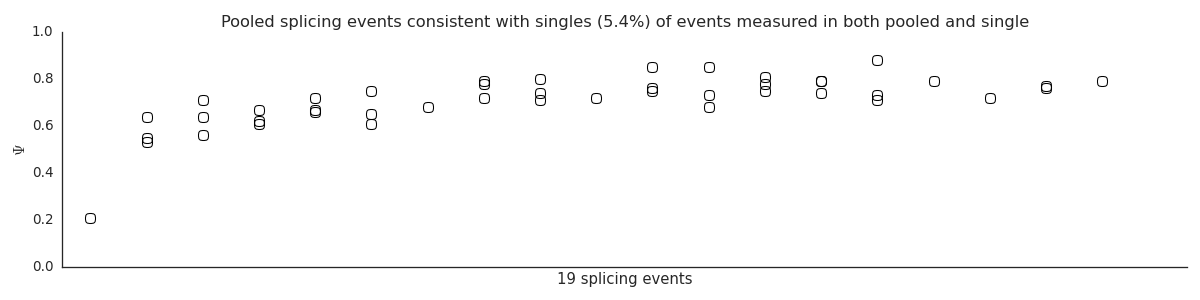
Visualize splicing events whose PSI in singles doesn’t match pooled
The colored points are the percent spliced in (PSI) scores of single cells, and the black-outlined circles are the PSI scores of the pooled samples.
Python source code: [download source: plot_lavalamp_pooled_inconsistent.py]
import flotilla
study = flotilla.embark(flotilla._shalek2013)
study.plot_lavalamp_pooled_inconsistent()