bonvoyage
:triangular_ruler: Transform percentage-based units into a 2d space to evaluate changes in distribution with both magnitude and direction.
![]()


What is bonvoyage?
Transform percentage-based units into a 2d space to evaluate changes in distribution with both magnitude and direction.
- Free software: BSD license
- Documentation: https://yeolab.github.io/bonvoyage
Installation
To install anchor, we recommend using the
Anaconda Python Distribution and creating an
environment, so the anchor code and dependencies don’t interfere with
anything else. Here is the command to create an environment:
conda create -n anchor-env pandas numpy matplotlib seaborn scikit-learn
Stable (recommended)
To install this code from the Python Package Index, you can install on the
command line via pip:
pip install bonvoyage
Bleeding-edge (for the brave)
To install this code, clone this github repository and use pip to install
git clone git@github.com:yeolab/bonvoyage
cd bonvoyage
pip install .  # The "." means "install *this*, the folder where I am now"
Usage
To use bonvoyage to get waypoints, you want your data to be a pandas
DataFrame of shape (n_samples, n_features)
import bonvoyage

wp = bonvoyage.Waypoints()
waypoints = wp.fit_transform(data)
bonvoyage is modeled after scikit-learn in is method of creating a
transforming object and then running fit_transform() to perform the computation.
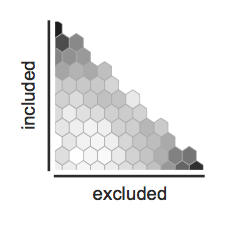
To plot the waypoints, use a waypointplot, which can do either "scatter" or
"hex" plot types. By default, hexbin plots are used:
import bonvoyage

bonvoyage.waypointplot(waypoints)
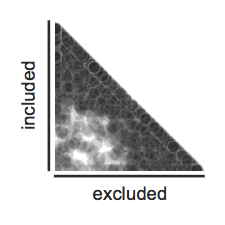
You can also specify to use scatter:
import bonvoyage

bonvoyage.waypointplot(waypoints, kind='scatter')
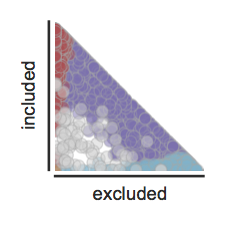
To add color, give a series or other groupby-able object:
import bonvoyage

bonvoyage.waypointplot(waypoints, kind='scatter', features_groupby=modalities)
History
1.0.0 (2017-06-28)
- Added tests and examples
0.1.0 (2015-09-15)
- First release on PyPI.