Visualize hierarchical relationships between samples and features

See alsoΒΆ

Study.interactive_graph()

../_images/plot_graph.png

Python source code: [download source: plot_graph.py]

import flotilla
study = flotilla.embark(flotilla._brainspan)
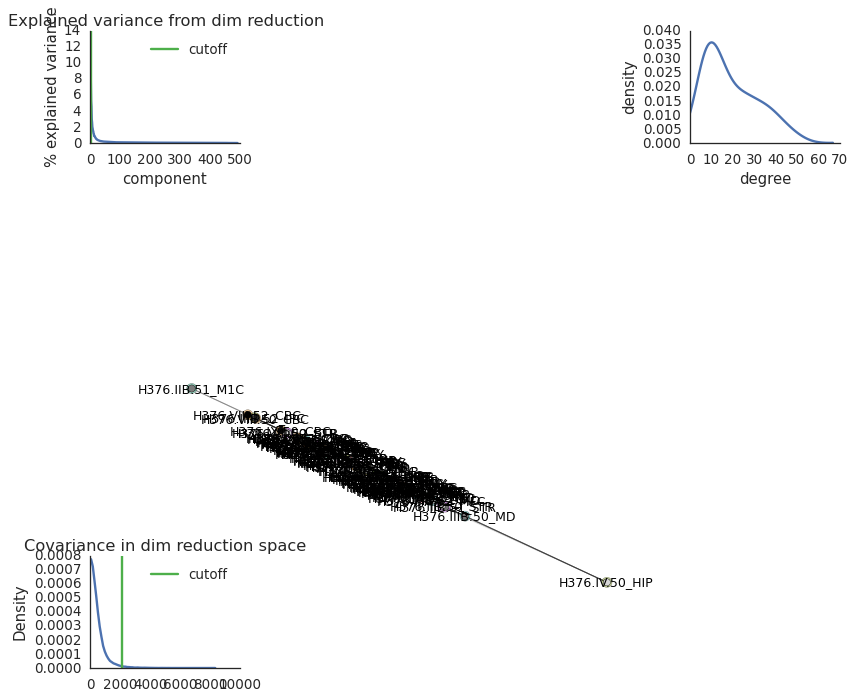
study.plot_graph(cov_std_cut=3, degree_cut=5)
Olga B. Botvinnik is funded by the NDSEG fellowship and is a NumFOCUS John Hunter Technology Fellow.
Michael T. Lovci was partially funded by a fellowship from Genentech.
Partially funded by NIH grants NS075449 and HG004659 and CIRM grants RB4-06045 and TR3-05676 to Gene Yeo.