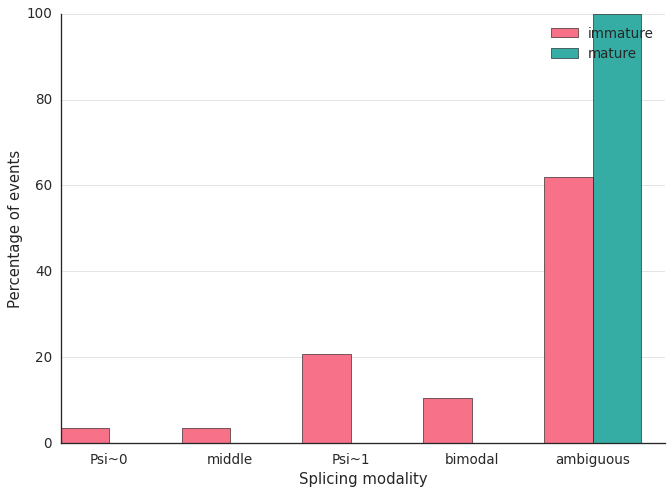
Plot bar graphs of percentage of splicing events in each modality

See also

Study.plot_modalities_bars()

../_images/plot_modalities_bars.png

Python source code: [download source: plot_modalities_bars.py]

import flotilla
study = flotilla.embark(flotilla._shalek2013)
study.plot_modalities_bars()
Olga B. Botvinnik is funded by the NDSEG fellowship and is a NumFOCUS John Hunter Technology Fellow.
Michael T. Lovci was partially funded by a fellowship from Genentech.
Partially funded by NIH grants NS075449 and HG004659 and CIRM grants RB4-06045 and TR3-05676 to Gene Yeo.